Org chart for PowerPoint
Build the chart online, export PNG, insert into PowerPoint or Google Slides — and update it when people move. Faster than SmartArt for most teams.
PowerPoint’s org chart SmartArt is fine until it isn’t — usually around the tenth box, when lines cross, names truncate, and a reorg means an hour of nudging.
A workflow that survives real companies: maintain the structure in a tool built for org charts, export PNG, drop it on a slide. Update the PNG when things change.
Why not SmartArt alone?
SmartArt still wins for a one-off slide with four names you will never update. For anything that changes quarterly, export is less fragile.
- Layout breaks as headcount grows — you become the layout engine.
- Every reorg is manual box editing, not “change manager and relayout”.
- Sharing the source file does not help colleagues who only need the picture.
1. Build the chart
Use the editor or follow how to create an org chart. Import from Excel if you already have a roster (CSV guide).
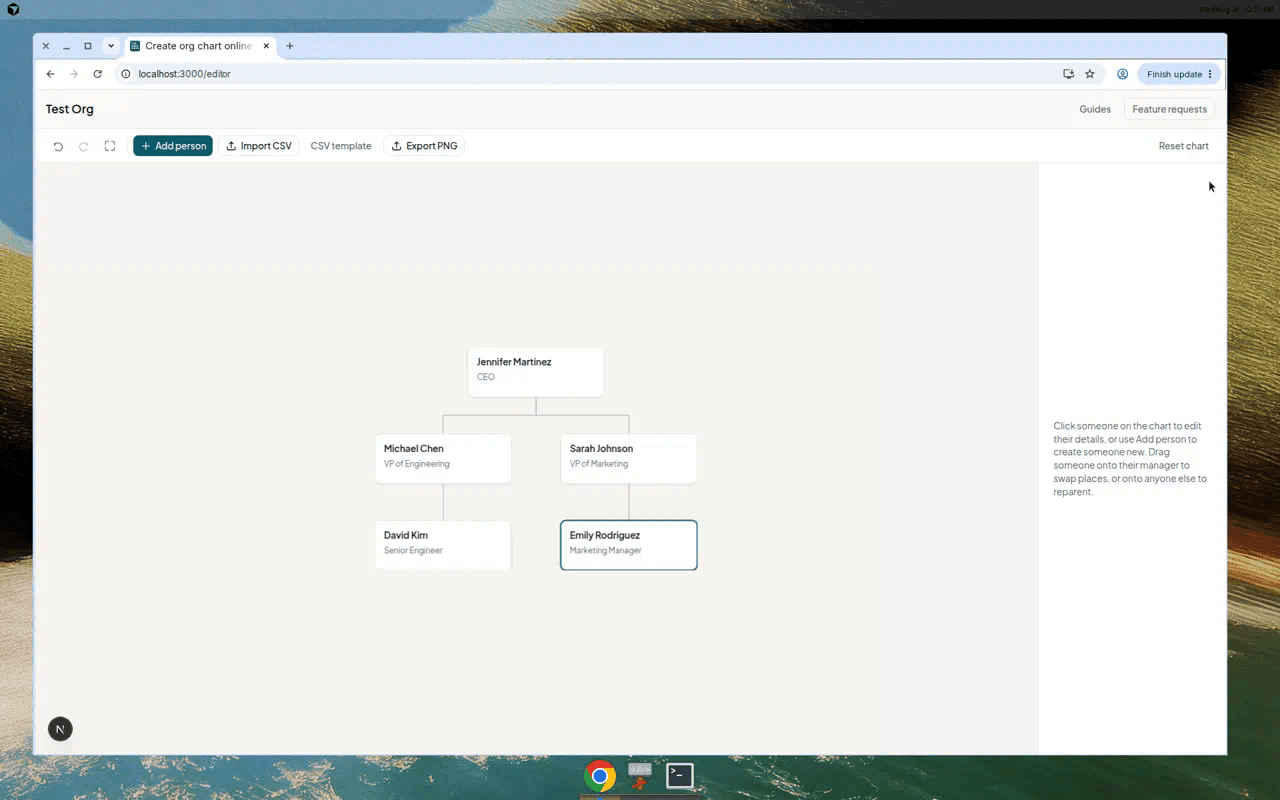
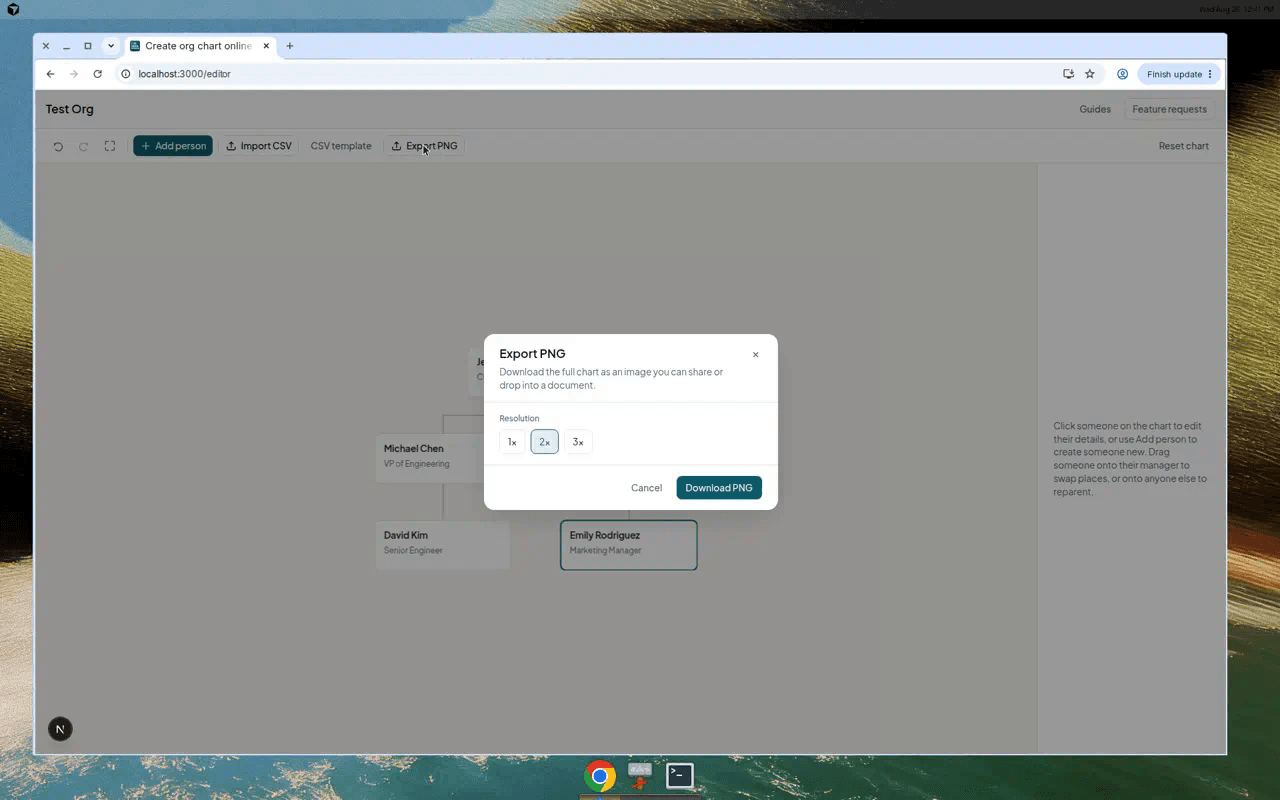
2. Export PNG
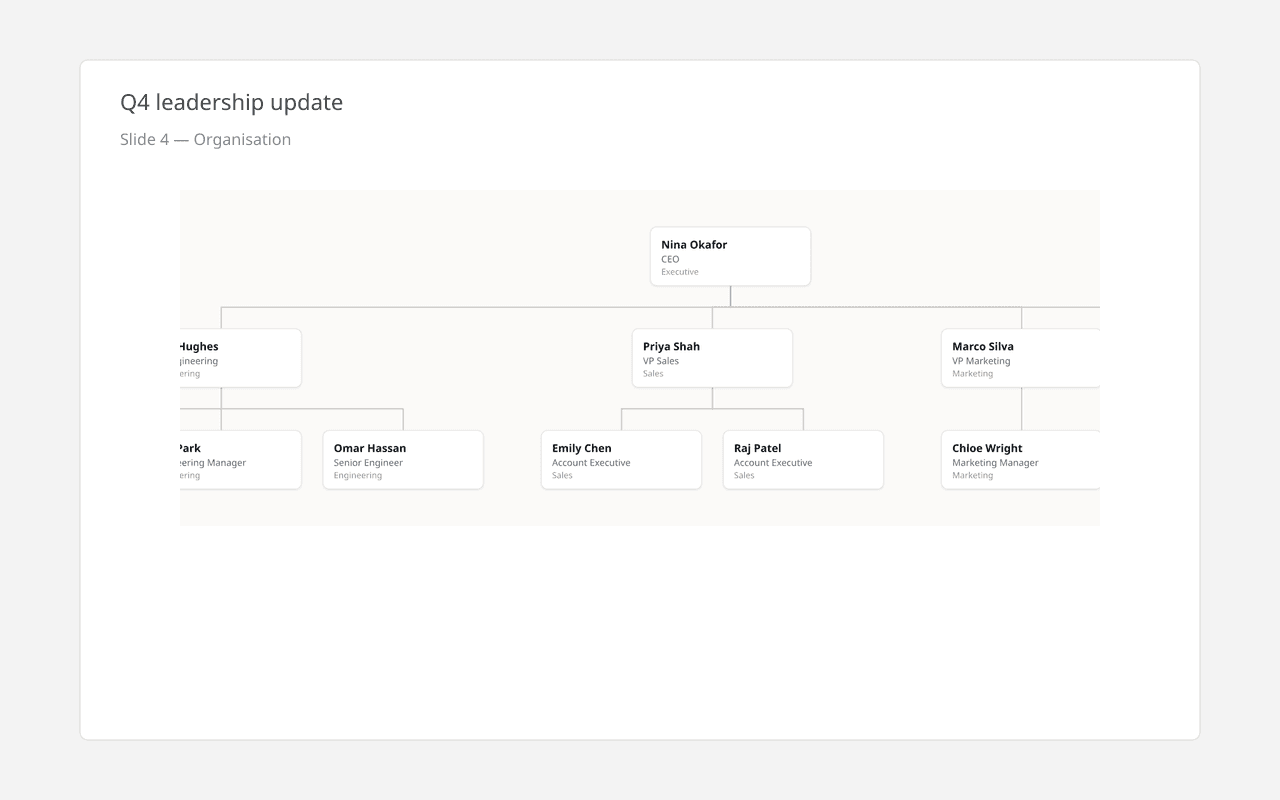
3. Insert on a slide
PowerPoint: Insert → Pictures → This Device. Google Slides: Insert → Image → Upload.
Resize from a corner handle to keep aspect ratio. Put the image on a slide with enough vertical space — org charts are often wider than they are tall.
4. When the org changes
Edit the chart in Simple Org Chart (drag to reparent, add leavers/joiners), re-export PNG, replace the image on the slide. Faster than rebuilding SmartArt, and you keep a single source of truth in the browser until the next export.
Label the slide “Organisation — Q3 2026” so stale decks are obvious.
Build the chart once
Export PNG whenever the structure changes — swap the slide image.
Open the editor