· Updated
What is an org chart? Definition, examples & free tool
What an org chart is, when to use one, and how to build yours free — CSV import, PNG export, no signup. Open the maker in your browser.
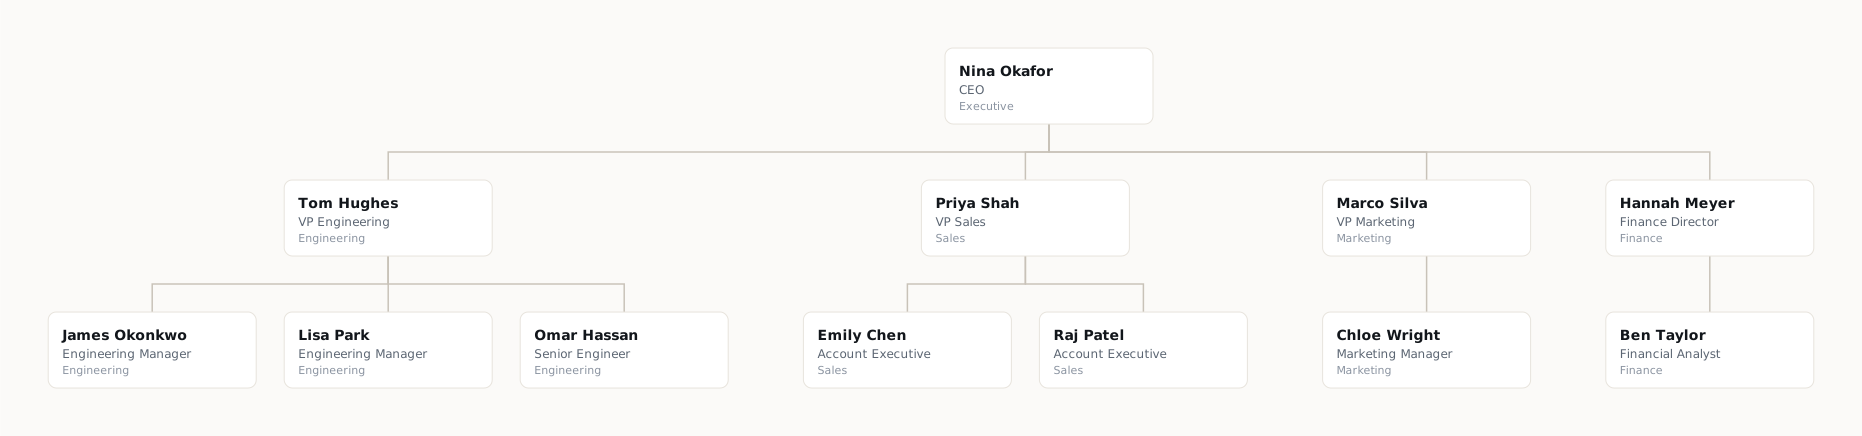
An org chart — also called an organizational chart or organization chart — shows who reports to whom. Boxes represent people or roles; lines connect each person to their manager. That is the whole idea: reporting structure, not process steps.
People search under different names (“org chart,” “organization chart,” “organisation chart” in UK English). The layout rules are the same. If you want to skip straight to building one, create an org chart free or browse company org chart examples first.
Organization chart or org chart?
There is no practical difference — “org chart” is shorthand. What matters is the data: every person (except the top role) has one direct manager in a standard chart. Matrix organizations need extra notation or separate project charts.
What goes on an organizational chart
Photos, email addresses, and location tags are optional. Keep the chart readable: once you pass ~30 people on one page, consider exporting a PNG of the top layers only, or splitting by division.
- Name — who holds the role (required).
- Job title — what they do (strongly recommended).
- Department or team — optional, useful once headcount grows.
- Reporting lines — solid connectors from manager down to direct reports.
When companies actually use organizational charts
Onboarding — new hires want to know who their manager is and who leads adjacent teams. A chart beats a paragraph in a handbook.
Reorganizations — when reporting lines change, a draft chart surfaces gaps (orphaned roles, overloaded managers) before you announce.
Board and investor slides — a single PNG of the leadership team is standard in quarterly updates.
“Who do I ask?” — cross-functional work stalls when nobody knows who owns a decision. A chart does not replace conversation, but it stops basic routing mistakes.
They are less useful when updated hourly — if your structure changes weekly, HR software with a live org view beats redrawing boxes by hand.
Common organizational chart structures
These shapes describe your organizational structure — how authority and teams are arranged — not just how boxes look on a page.
Functional — grouped by discipline (engineering, sales, finance). Most companies past ~20 people. Clear ownership; cross-team projects can feel slow.
Flat — one leader with many direct reports, few layers. Common in early startups. Breaks down once anyone has more than ~10 reports.
Divisional — separate mini-hierarchies by product, region, or customer type. Works when divisions run like small companies; duplicates support roles at the center.
See organizational chart examples for fictional layouts of each shape drawn in Simple Org Chart — easier to compare than text alone.
How to make an organizational chart
Three paths cover most real-world situations. Pick the one that matches where your data already lives.
| Approach | Best when | Trade-off |
|---|---|---|
| Spreadsheet list → import | Names already in Excel or Google Sheets | You still need a tool to draw lines — import saves retyping |
| Office SmartArt / Drawings | Tiny chart (under ~10 people), lives only in one deck | Manual relayout every reorg; painful at scale |
| Dedicated org chart maker | Readable organizational chart today, updated a few times a year | Another tab or subscription unless you pick a free browser tool |
Build from scratch in the browser
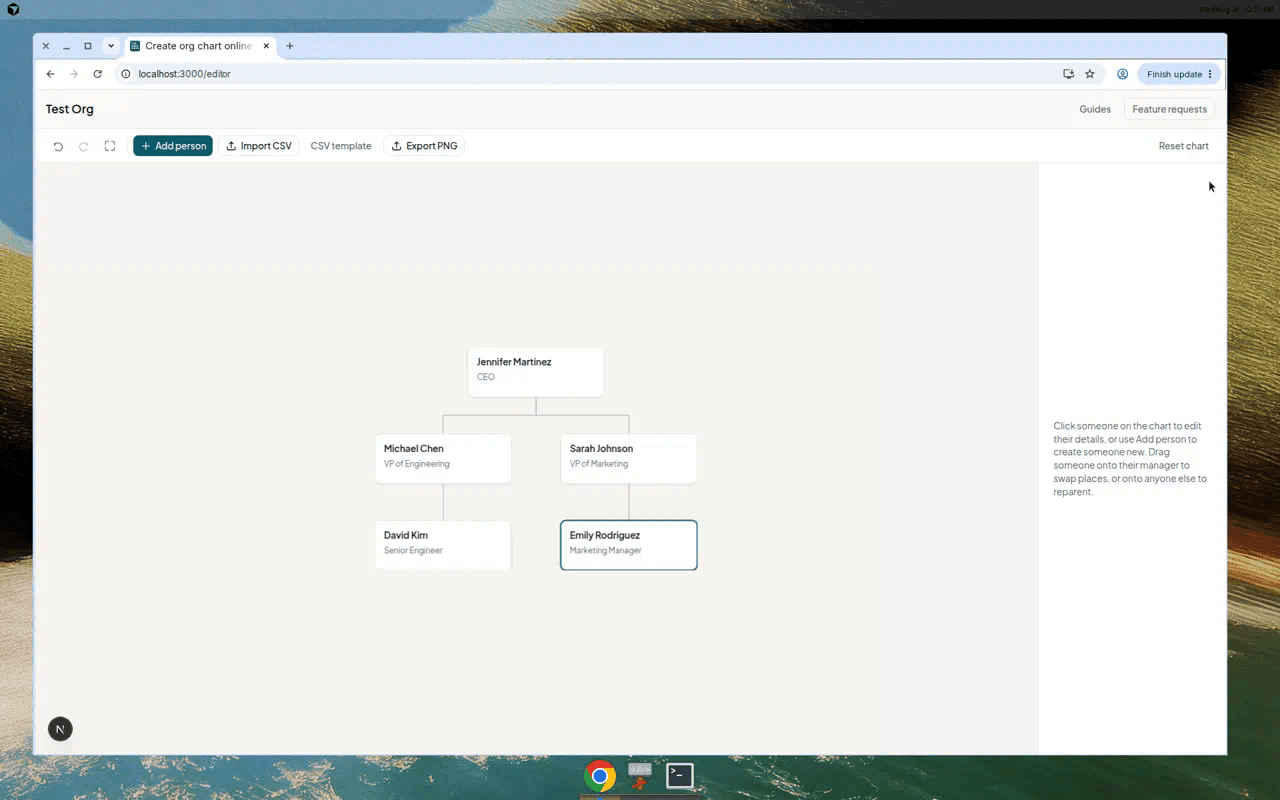
Start with the most senior person, add direct reports, drag to fix mistakes. How to create an org chart walks through the editor step by step. You can also create an organizational chart directly — free, no account, layout is automatic.
Build from a spreadsheet (CSV)
If HR already maintains a list, export Name and Reports to columns. Download the free org chart template, paste your rows, and import CSV in one step. Fix typos in the preview before you commit — a misspelled manager name creates a second root by accident.
Build inside Microsoft Office or Google Workspace
PowerPoint SmartArt and Excel hierarchy charts work for very small teams. Every reorg means repositioning boxes by hand. For a slide-ready PNG without the SmartArt fight, see org chart for PowerPoint and our Microsoft org chart alternative notes.
Organizational chart templates
A template is just a starter file — usually CSV with column headers and example rows. You need at minimum Name and Reports to. Optional columns (title, department, email) improve the finished chart but are not required.
Avoid templates that only provide empty boxes in PowerPoint unless you enjoy aligning rectangles. A data-first CSV template scales to 100+ people; SmartArt does not.
Download ours from the free org chart template page or the editor toolbar.
Organizational chart software: what to look for
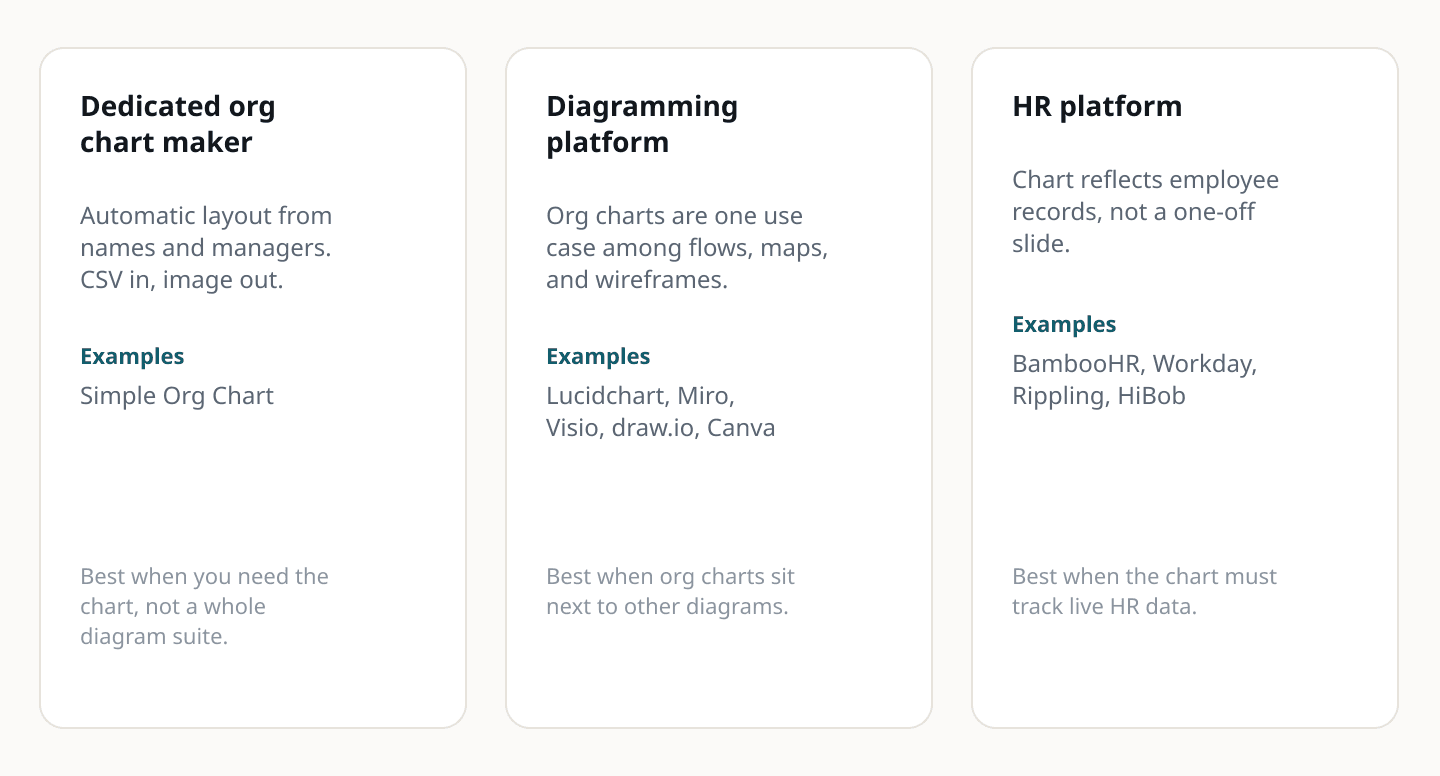
Enterprise HR platforms (Workday, BambooHR, Rippling) win when the chart must stay synced with payroll. Diagram suites (Visio, Lucidchart, draw.io) win when you already diagram everything else there.
When you need one chart for a deck by Friday, a lightweight organizational chart maker in the browser is often enough — import a CSV, adjust by dragging, export PNG. Simple Org Chart is built for that job; it is not an HR system or a full diagram suite.
For an honest comparison of free organizational chart software, read best free org chart software — we do not pretend to win every category.
- Can you start without creating an account?
- CSV or spreadsheet import when the roster already exists?
- Automatic layout as headcount grows?
- PNG export for slides and documents?
- Undo when you drag the wrong person onto the wrong manager?
Organizational chart in PowerPoint
Most PowerPoint org charts are static images on a slide — not live SmartArt. Build or import the chart elsewhere, export your organizational chart as PNG, insert the image. Text stays readable, and you replace one file when the structure changes. Full workflow: org chart for PowerPoint.
Organizational chart in Excel
Excel is excellent for the data (Name, Reports to) and weak for the picture. Maintain the list in a sheet, save as CSV, import into a layout tool. Trying to draw 50 connected boxes in a spreadsheet wastes time you could spend fixing reporting lines. Start from the CSV template if you already live in Excel.
Corporate organizational charts
A corporate organizational chart usually means the legal or executive hierarchy — CEO, C-suite, division heads — rather than every individual contributor. Public companies often publish a trimmed version for investors; internal charts go deeper.
The drawing rules are the same. Depth is a editorial choice: board slides might show three layers; HR might maintain ten. Simple Org Chart handles both — zoom and export the view you need.
FAQ
- What is an organizational chart? A diagram showing reporting relationships — who manages whom — usually drawn top-down with boxes and connecting lines.
- What is the difference between an org chart and an organizational chart? None. “Org chart” is shorthand for the same diagram.
- How do I make an organizational chart for free? Use a free online org chart maker: add people manually, or import a CSV with Name and Reports to columns, then export PNG for slides.
- What should be included on an organizational chart? At minimum: names and reporting lines. Job titles and departments are strongly recommended; contact details are optional.
- What are the types of organizational charts? Common shapes include functional (by department), flat (few layers), divisional (by product or region), and matrix (dual reporting — often simplified on paper).
- How often should an organizational chart be updated? After any reorg, new executive hire, or board presentation — at least quarterly at growing companies. Stale charts erode trust faster than no chart.
Build your org chart
Open the free organizational chart maker or import a CSV — no sign-up required.
Create org chart